



Written by Michael Bernaiche, January 16th, 2024
On December 20, 2024, IBM released the latest version of Planning Analytics Workspace 2.1.7. This update brings a host of new features and enhancements designed to streamline your data modeling, reporting, and planning processes. Whether you're a seasoned data analyst or just starting your journey, Planning Analytics Workspace 2.1.7 offers powerful tools to help you achieve your goals more efficiently. From improved performance monitoring to enhanced security features, this release is packed with innovations that will elevate your analytics experience.
Ready to explore the new features? Let's get started!
Important Note BEFORE Upgrading to Planning Analytics Workspace 2.1.7
You must backup your Planning Analytics Workspace Local content prior to upgrading to Workspace 2.1.7 and then restore your content after the upgrade is complete.
Backup and restoration is required because Planning Analytics Workspace Local 2.1.7 uses a new version of MongoDB database and the Planning Analytics Workspace Local installation process cannot directly update content on the database. MongoDB stores books and other assets that are required by your Planning Analytics Workspace environment.
For more information on backup and restore please see the following link.
Books and Reporting
AI – Generated Insights with Chart Insights – this is an exciting brand new feature in Planning Analytics Workspace 2.1.7 or 2.0 version 99. These insights will provide summaries and key points to allow the user to interpret the data in charts. With Chart insights, depending on the chart type and the chart data, you can get an overview of the chart, statistics and trends, trend analysis, insights, notable observations, and more. The Summary tab provides a more detailed analysis of the chart than the Key points.
Chart insights support the following charts for analysis: Area, Bar, Box plot, Dual axes column, Dual axes line, Line, Line and column, Pie, Point, Radar, Radial, Stacked bar, Stacked column, Waterfall, Word cloud

Best Practices for generating insights.
Here are a few things that you can do that might lead the AI model to generate better insights:
- Chart has data and is not empty
- Chart data is in context of the cube
- Cube, dimension, and member names are descriptive and accurately represent the data
- There are no named outliers for dimensions that might confuse the AI model
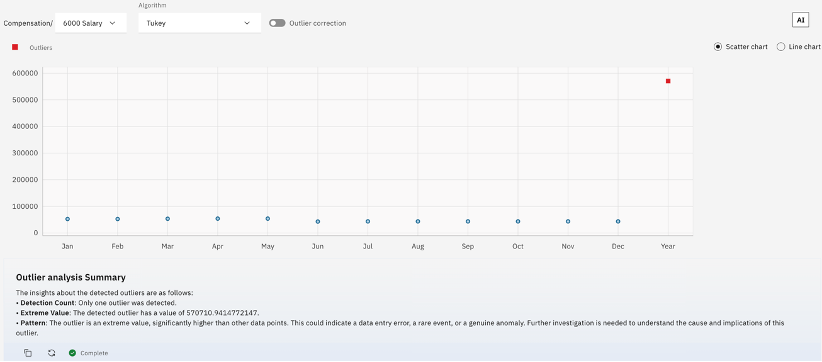
Perform AI-driven Outlier Analysis on Explorations – Use outlier analysis to identify and correct data in an exploration that are significantly different from the norm. This could be a potential error or just an anomaly.
Please note – this is part of the PA AI Assistant and needs a separate license purchase.
Plans and Applications
My Task Tab on Homepage - This new feature is divided into 3 areas: Task summary, To Do and Done.


For all the details of each section check out this link.
Summary
What a great update to Planning Analytics Workspace. As I write this, we are updating our demo server, and I can’t wait to bring more start using the insights area. Those of you reading this blog who use Cognos Analytics, you will see this looks very similar. I can’t wait to demo this!!
We have a great training opportunity for you. On February 13, 2025, we are hosting virtual Planning Analytics administrator and workspace training. This 4-hour session covers a ton of info and our clients who have taken this training, just love it! Reach out to me at services@lodestarsolutions.com to get more information and see if this training is right for you!
Last, to read about everything new recently in planning analytics workspace you can always check out past blogs here.
